10663 (T > C)

General info

Mitimpact ID
MI.16101
Chr
chrM
Start
10663
Ref
T
Alt
C
Gene symbol
MT-ND4L Extended gene annotation
Gene position
194
Gene start
10470
Gene end
10766
Gene strand
+
Codon substitution
GTC/GCC
AA pos
65
AA ref
V
AA alt
A
Functional effect
missense
OMIM ID
HGVS
NC_012920.1:g.10663T>C
HGNC ID
RC complex
I
Ensembl gene ID
Ensembl protein ID
Ensembl transcript ID
Uniprot ID
Uniprot name
Ncbi gene ID
Ncbi protein ID
Powered by NGL Viewer
Powered by MitoWheel

Conservation

PhyloP 100v
5.839 Conservation Score
PhyloP 470way
0.666 Conservation Score
PhastCons 100v
0.958 Conservation Score
PhastCons 470way
0.017 Conservation Score

Pathogenicity predictors

PolyPhen2
Possibly damaging Score and details of the predictor
SIFT
Neutral Score and details of the predictor
SIFT4G
Tolerated Score and details of the predictor
VEST
Neutral Score and details of the predictor
MitoClass 1
Neutral Score and details of the predictor
SNPDryad
Neutral Score and details of the predictor
MutationTaster
Disease automatic Score and details of the predictor
fathmm
Tolerated Score and details of the predictor
AlphaMissense
Ambiguous Score and details of the predictor
CADD
Neutral Score and details of the predictor
PROVEAN
Damaging Score and details of the predictor
Mutation Assessor
Low Score and details of the predictor
EFIN SP
Damaging Score and details of the predictor
EFIN HD
Damaging Score and details of the predictor
MLC
Deleterious Score and details of the predictor
PANTHER
Neutral Score and details of the predictor
PhD-SNP
Neutral Score and details of the predictor

Pathogenicity meta-predictors

APOGEE1
Pathogenic Score and details of the meta-predictor
APOGEE2
Likely-pathogenic Score and details of the meta-predictor
CAROL
Neutral Score and details of the meta-predictor
Condel
Neutral Score and details of the meta-predictor
COVEC WMV
.
MtoolBox
Deleterious Score and details of the meta-predictor
DEOGEN2
Tolerated Score and details of the meta-predictor
Meta SNP
Neutral Score and details of the meta-predictor

Cancer-specific predictors

PolyPhen2 transf
Low impact Score and details of the cancer-specific predictor
SIFT transf
Medium impact Score and details of the cancer-specific predictor
MutationAssessor transf
Medium impact Score and details of the cancer-specific predictor
CHASM
Neutral Score and details of the cancer-specific predictor

Databases of Frequencies and Phenotypes

Clinvar ID
Clinvar ALLELEID
24746
Clinvar CLNDISDB
Mondo:mondo:0044970, medgen:c0751651, orphanet:68380;

human phenotype ontology:hp:0001086, human phenotype ontology:hp:0001112, mondo:mondo:0010788, medgen:c0917796, omim:535000, orphanet:104
Clinvar CLNDN
Mitochondrial disease;

leber optic atrophy
Clinvar CLNSIG
Likely pathogenic
MITOMAP Allele
MITOMAP Disease Clinical info
Lhon
MITOMAP Disease Status
Cfrm [lp]
MITOMAP Disease Hom/Het
+/-
MITOMAP General GenBank Freq
0.0033%
MITOMAP General GenBank Seqs
2
MITOMAP Variant Class
disease
Gnomad AN
56429
Gnomad AC hom
0
Gnomad AF hom
0.0
Gnomad AC het
0
Gnomad AF het
0.0
Gnomad filter
Npg
HelixMTdb AC hom
1
HelixMTdb AF hom
5.1e-06
HelixMTdb AC het
1
HelixMTdb AF het
5.1e-06
HelixMTdb mean ARF
0.10714
HelixMTdb max ARF
0.10714
ToMMo JPN54K AC
1
ToMMo JPN54K AF
1.8e-05
ToMMo JPN54K AN
54302
COSMIC 90
.
dbSNP 156

Residue interaction

EVmutation
Site A-B InterP
Site A-B IntraP
ΔΔG intra
ΔΔG intra interface
ΔΔG inter

Compensated Pathogenic Deviations

Frequency
.
AA ref
.
CPD AA alt
.
Aln pos
.
RefSeq protein ID
.
Species name
.
Ncbi taxon ID
.

10663 (T > A)

General info

Mitimpact ID
MI.16102
Chr
chrM
Start
10663
Ref
T
Alt
A
Gene symbol
MT-ND4L Extended gene annotation
Gene position
194
Gene start
10470
Gene end
10766
Gene strand
+
Codon substitution
GTC/GAC
AA pos
65
AA ref
V
AA alt
D
Functional effect
missense
OMIM ID
HGVS
NC_012920.1:g.10663T>A
HGNC ID
RC complex
I
Ensembl gene ID
Ensembl protein ID
Ensembl transcript ID
Uniprot ID
Uniprot name
Ncbi gene ID
Ncbi protein ID
Powered by NGL Viewer
Powered by MitoWheel

Conservation

PhyloP 100v
5.839 Conservation Score
PhyloP 470way
0.666 Conservation Score
PhastCons 100v
0.958 Conservation Score
PhastCons 470way
0.017 Conservation Score

Pathogenicity predictors

PolyPhen2
Probably damaging Score and details of the predictor
SIFT
Neutral Score and details of the predictor
SIFT4G
Damaging Score and details of the predictor
VEST
Neutral Score and details of the predictor
MitoClass 1
Damaging Score and details of the predictor
SNPDryad
Pathogenic Score and details of the predictor
MutationTaster
Disease Score and details of the predictor
fathmm
Tolerated Score and details of the predictor
AlphaMissense
Likely pathogenic Score and details of the predictor
CADD
Deleterious Score and details of the predictor
PROVEAN
Damaging Score and details of the predictor
Mutation Assessor
.
EFIN SP
Neutral Score and details of the predictor
EFIN HD
Neutral Score and details of the predictor
MLC
Deleterious Score and details of the predictor
PANTHER
.
PhD-SNP
.

Pathogenicity meta-predictors

APOGEE1
Neutral Score and details of the meta-predictor
APOGEE2
Likely-pathogenic Score and details of the meta-predictor
CAROL
Deleterious Score and details of the meta-predictor
Condel
Neutral Score and details of the meta-predictor
COVEC WMV
Deleterious Score and details of the meta-predictor
MtoolBox
Deleterious Score and details of the meta-predictor
DEOGEN2
Tolerated Score and details of the meta-predictor
Meta SNP
.

Cancer-specific predictors

PolyPhen2 transf
Low impact Score and details of the cancer-specific predictor
SIFT transf
Medium impact Score and details of the cancer-specific predictor
MutationAssessor transf
High impact Score and details of the cancer-specific predictor
CHASM
Neutral Score and details of the cancer-specific predictor

Databases of Frequencies and Phenotypes

Clinvar ID
.
Clinvar ALLELEID
.
Clinvar CLNDISDB
.
Clinvar CLNDN
.
Clinvar CLNSIG
.
MITOMAP Allele
MITOMAP Disease Clinical info
.
MITOMAP Disease Status
.
MITOMAP Disease Hom/Het
./.
MITOMAP General GenBank Freq
.
MITOMAP General GenBank Seqs
.
MITOMAP General GenBank Curated refs
.
MITOMAP Variant Class
.
Gnomad AN
0
Gnomad AC hom
0
Gnomad AF hom
0.0
Gnomad AC het
.
Gnomad AF het
.
Gnomad filter
.
HelixMTdb AC hom
0
HelixMTdb AF hom
0.0
HelixMTdb AC het
.
HelixMTdb AF het
0.0
HelixMTdb mean ARF
0.0
HelixMTdb max ARF
.
ToMMo JPN54K AC
.
ToMMo JPN54K AF
.
ToMMo JPN54K AN
.
COSMIC 90
.
dbSNP 156

Residue interaction

EVmutation
Site A-B InterP
Site A-B IntraP
ΔΔG intra
ΔΔG intra interface
ΔΔG inter

Compensated Pathogenic Deviations

Frequency
.
AA ref
.
CPD AA alt
.
Aln pos
.
RefSeq protein ID
.
Species name
.
Ncbi taxon ID
.

10663 (T > G)

General info

Mitimpact ID
MI.16103
Chr
chrM
Start
10663
Ref
T
Alt
G
Gene symbol
MT-ND4L Extended gene annotation
Gene position
194
Gene start
10470
Gene end
10766
Gene strand
+
Codon substitution
GTC/GGC
AA pos
65
AA ref
V
AA alt
G
Functional effect
missense
OMIM ID
HGVS
NC_012920.1:g.10663T>G
HGNC ID
RC complex
I
Ensembl gene ID
Ensembl protein ID
Ensembl transcript ID
Uniprot ID
Uniprot name
Ncbi gene ID
Ncbi protein ID
Powered by NGL Viewer
Powered by MitoWheel

Conservation

PhyloP 100v
5.839 Conservation Score
PhyloP 470way
0.666 Conservation Score
PhastCons 100v
0.958 Conservation Score
PhastCons 470way
0.017 Conservation Score

Pathogenicity predictors

PolyPhen2
Probably damaging Score and details of the predictor
SIFT
Neutral Score and details of the predictor
SIFT4G
Damaging Score and details of the predictor
VEST
Neutral Score and details of the predictor
MitoClass 1
Damaging Score and details of the predictor
SNPDryad
Pathogenic Score and details of the predictor
MutationTaster
Disease Score and details of the predictor
fathmm
Tolerated Score and details of the predictor
AlphaMissense
Ambiguous Score and details of the predictor
CADD
Deleterious Score and details of the predictor
PROVEAN
Damaging Score and details of the predictor
Mutation Assessor
.
EFIN SP
Neutral Score and details of the predictor
EFIN HD
Neutral Score and details of the predictor
MLC
Deleterious Score and details of the predictor
PANTHER
.
PhD-SNP
.

Pathogenicity meta-predictors

APOGEE1
Neutral Score and details of the meta-predictor
APOGEE2
Vus+ Score and details of the meta-predictor
CAROL
Neutral Score and details of the meta-predictor
Condel
Neutral Score and details of the meta-predictor
COVEC WMV
Deleterious Score and details of the meta-predictor
MtoolBox
Deleterious Score and details of the meta-predictor
DEOGEN2
Tolerated Score and details of the meta-predictor
Meta SNP
.

Cancer-specific predictors

PolyPhen2 transf
Low impact Score and details of the cancer-specific predictor
SIFT transf
Medium impact Score and details of the cancer-specific predictor
MutationAssessor transf
Medium impact Score and details of the cancer-specific predictor
CHASM
Neutral Score and details of the cancer-specific predictor

Databases of Frequencies and Phenotypes

Clinvar ID
.
Clinvar ALLELEID
.
Clinvar CLNDISDB
.
Clinvar CLNDN
.
Clinvar CLNSIG
.
MITOMAP Allele
MITOMAP Disease Clinical info
.
MITOMAP Disease Status
.
MITOMAP Disease Hom/Het
./.
MITOMAP General GenBank Freq
.
MITOMAP General GenBank Seqs
.
MITOMAP General GenBank Curated refs
.
MITOMAP Variant Class
.
Gnomad AN
0
Gnomad AC hom
0
Gnomad AF hom
0.0
Gnomad AC het
.
Gnomad AF het
.
Gnomad filter
.
HelixMTdb AC hom
0
HelixMTdb AF hom
0.0
HelixMTdb AC het
.
HelixMTdb AF het
0.0
HelixMTdb mean ARF
0.0
HelixMTdb max ARF
.
ToMMo JPN54K AC
.
ToMMo JPN54K AF
.
ToMMo JPN54K AN
.
COSMIC 90
.
dbSNP 156

Residue interaction

EVmutation
Site A-B InterP
Site A-B IntraP
ΔΔG intra
ΔΔG intra interface
ΔΔG inter

Compensated Pathogenic Deviations

Frequency
.
AA ref
.
CPD AA alt
.
Aln pos
.
RefSeq protein ID
.
Species name
.
Ncbi taxon ID
.
~ 10663 (T/C) 10663 (T/A) 10663 (T/G)
~ 10663 (GTC/GCC) 10663 (GTC/GAC) 10663 (GTC/GGC)
MitImpact id MI.16101 MI.16102 MI.16103
Chr chrM chrM chrM
Start 10663 10663 10663
Ref T T T
Alt C A G
Gene symbol MT-ND4L MT-ND4L MT-ND4L
Extended annotation mitochondrially encoded NADH:ubiquinone oxidoreductase core subunit 4L mitochondrially encoded NADH:ubiquinone oxidoreductase core subunit 4L mitochondrially encoded NADH:ubiquinone oxidoreductase core subunit 4L
Gene position 194 194 194
Gene start 10470 10470 10470
Gene end 10766 10766 10766
Gene strand + + +
Codon substitution GTC/GCC GTC/GAC GTC/GGC
AA position 65 65 65
AA ref V V V
AA alt A D G
Functional effect general missense missense missense
Functional effect detailed missense missense missense
OMIM id 516004 516004 516004
HGVS NC_012920.1:g.10663T>C NC_012920.1:g.10663T>A NC_012920.1:g.10663T>G
HGNC id 7460 7460 7460
Respiratory Chain complex I I I
Ensembl gene id ENSG00000212907 ENSG00000212907 ENSG00000212907
Ensembl transcript id ENST00000361335 ENST00000361335 ENST00000361335
Ensembl protein id ENSP00000354728 ENSP00000354728 ENSP00000354728
Uniprot id P03901 P03901 P03901
Uniprot name NU4LM_HUMAN NU4LM_HUMAN NU4LM_HUMAN
Ncbi gene id 4539 4539 4539
Ncbi protein id YP_003024034.1 YP_003024034.1 YP_003024034.1
PhyloP 100V 5.839 5.839 5.839
PhyloP 470Way 0.666 0.666 0.666
PhastCons 100V 0.958 0.958 0.958
PhastCons 470Way 0.017 0.017 0.017
PolyPhen2 possibly_damaging probably_damaging probably_damaging
PolyPhen2 score 0.8 0.98 0.97
SIFT neutral neutral neutral
SIFT score 0.62 0.2 0.36
SIFT4G Tolerated Damaging Damaging
SIFT4G score 0.78 0.002 0.001
VEST Neutral Neutral Neutral
VEST pvalue 0.43 0.11 0.27
VEST FDR 0.55 0.4 0.45
Mitoclass.1 neutral damaging damaging
SNPDryad Neutral Pathogenic Pathogenic
SNPDryad score 0.89 0.98 0.97
MutationTaster Disease automatic Disease Disease
MutationTaster score 0.119491 0.999822 0.999882
MutationTaster converted rankscore 0.28057 0.49512 0.50402
MutationTaster model simple_aae simple_aae simple_aae
MutationTaster AAE V65A V65D V65G
fathmm Tolerated Tolerated Tolerated
fathmm score 1.53 1.39 1.4
fathmm converted rankscore 0.30401 0.33842 0.33630
AlphaMissense ambiguous likely_pathogenic ambiguous
AlphaMissense score 0.481 0.8768 0.4647
CADD Neutral Deleterious Deleterious
CADD score 1.283142 4.677783 3.80185
CADD phred 12.18 24.6 23.4
PROVEAN Damaging Damaging Damaging
PROVEAN score -3.98 -6.89 -6.96
MutationAssessor low . .
MutationAssessor score 1.81 . .
EFIN SP Damaging Neutral Neutral
EFIN SP score 0.282 0.698 0.74
EFIN HD Damaging Neutral Neutral
EFIN HD score 0.248 0.37 0.448
MLC Deleterious Deleterious Deleterious
MLC score 0.86417406 0.86417406 0.86417406
PANTHER score 0.186 . .
PhD-SNP score 0.365 . .
APOGEE1 Pathogenic Neutral Neutral
APOGEE1 score 0.9 0.42 0.35
APOGEE2 Likely-pathogenic Likely-pathogenic VUS+
APOGEE2 score 0.822444774874523 0.797387310784568 0.5482248040465
CAROL neutral deleterious neutral
CAROL score 0.77 0.99 0.97
Condel neutral neutral neutral
Condel score 0.41 0.11 0.2
COVEC WMV . deleterious deleterious
COVEC WMV score 0 2 1
MtoolBox deleterious deleterious deleterious
MtoolBox DS 0.58 0.85 0.79
DEOGEN2 Tolerated Tolerated Tolerated
DEOGEN2 score 0.100741 0.318592 0.10859
DEOGEN2 converted rankscore 0.40683 0.68995 0.42176
Meta-SNP Neutral . .
Meta-SNP score 0.254 . .
PolyPhen2 transf low impact low impact low impact
PolyPhen2 transf score -1.35 -2.35 -2.19
SIFT_transf medium impact medium impact medium impact
SIFT transf score 0.33 -0.12 0.07
MutationAssessor transf medium impact high impact medium impact
MutationAssessor transf score 0.66 2.19 1.23
CHASM Neutral Neutral Neutral
CHASM pvalue 0.33 0.53 0.5
CHASM FDR 0.8 0.8 0.8
ClinVar id 9707.0 . .
ClinVar Allele id 24746.0 . .
ClinVar CLNDISDB MONDO:MONDO:0044970,MedGen:C0751651,Orphanet:68380|Human_Phenotype_Ontology:HP:0001086,Human_Phenotype_Ontology:HP:0001112,MONDO:MONDO:0010788,MedGen:C0917796,OMIM:535000,Orphanet:104 . .
ClinVar CLNDN Mitochondrial_disease|Leber_optic_atrophy . .
ClinVar CLNSIG Likely_pathogenic . .
MITOMAP Disease Clinical info LHON . .
MITOMAP Disease Status Cfrm [LP] . .
MITOMAP Disease Hom/Het +/- ./. ./.
MITOMAP General GenBank Freq 0.0033% . .
MITOMAP General GenBank Seqs 2 . .
MITOMAP General Curated refs 31817256;22879922;24568867;28991104;29210930;18402672;15972314;29987491;35778412;20301353;16523671;11935318;21457906;8680405;17003408;29253894 . .
MITOMAP Variant Class disease . .
gnomAD 3.1 AN 56429.0 . .
gnomAD 3.1 AC Homo 0.0 . .
gnomAD 3.1 AF Hom 0.0 . .
gnomAD 3.1 AC Het 0.0 . .
gnomAD 3.1 AF Het 0.0 . .
gnomAD 3.1 filter npg . .
HelixMTdb AC Hom 1.0 . .
HelixMTdb AF Hom 5.1024836e-06 . .
HelixMTdb AC Het 1.0 . .
HelixMTdb AF Het 5.1024836e-06 . .
HelixMTdb mean ARF 0.10714 . .
HelixMTdb max ARF 0.10714 . .
ToMMo 54KJPN AC 1 . .
ToMMo 54KJPN AF 1.8e-05 . .
ToMMo 54KJPN AN 54302 . .
COSMIC 90 . . .
dbSNP 156 id rs1556423844 . .
For more info, please check the output legend.
ΔΔG values >±0.61 Kcal/mol are indicative of disrupting variants.
ΔΔG values close to zero (<±0.1 Kcal/mol) are indicative of possibly
compensating double mutants.
For more info, please check the output legend.
ΔΔG values >±0.61 Kcal/mol are indicative of disrupting variants.
ΔΔG values close to zero (<±0.1 Kcal/mol) are indicative of possibly
compensating double mutants.
For more info, please check the output legend.
ΔΔG values >±0.61 Kcal/mol are indicative of disrupting variants.
ΔΔG values close to zero (<±0.1 Kcal/mol) are indicative of possibly
compensating double mutants.
For more info, please check the output legend.
0
Details:
0
Score:  
0
  [min -20, max 10]
  • Predicted accelerated evolution:  score <= 0
  • Conserved:  score > 0
Score:  
0
  [min -20, max 12]
  • Predicted accelerated evolution:  score <= 0
  • Conserved:  score > 0
Score:  
0
  [min 0, max 1]
  • Non-conserved:  score <= 0.7
  • Conserved:  score > 0.7 (soft threshold)
Score:  
0
  [min 0, max 1]
  • Non-conserved:  score <= 0.7
  • Conserved:  score > 0.7 (soft threshold)
Score:  
0
  [min 0, max 1]
  • Neutral:  score <= 0.15
  • Possibly damaging:  0.15 < score <= 0.85
  • Probably damaging:  score > 0.85
Score:  
0
  [min 0, max 1]
  • Neutral:  score > 0.05
  • Deleterious:  score <= 0.05
Score:  
0
  [min 0, max 1]
  • Neutral:  score > 0.05
  • Deleterious:  score <= 0.05
Score:  
0
  [min -16.13, max 10.64]
  • Neutral:  score > 1.5
  • Deleterious:  score <= 1.5
Score:  
0
  [min 0.0, max 1.0]
  • Likely benign:  score <= 0.34
  • Ambiguous:  0.34 < score < 0.56
  • Likely pathogenic:  score >= 0.56
Score:  
0
  [min -14, max 14]
  • Neutral:  score > -2.5
  • Deleterious:  score <= -2.5 (soft threshold)
Score:  
0
  [min -6, max 6]
  • Neutral:  score <= 0.8
  • Low impact:  0.8 < score <= 1.9
  • Medium impact:  1.9 < score <= 3.5
  • High impact:  score > 3.5
Score:  
0
  [min 0, max 1]
  • Neutral:  score > 0.6
  • Damaging:  score <= 0.6
Score:  
0
  [min 0, max 1]
  • Neutral:  score > 0.28
  • Damaging:  score <= 0.28
Phred score:  
0
  [min 0, max Unlimited]
  • Neutral:  score < 20 (soft threshold)
  • Deleterious:  score >= 20
Score:  
0
  [min 0, max 1]
  • Neutral:  score < 0.5 (soft threshold)
  • Deleterious:  score >= 0.5
Score:  
0
  [min 0, max 1]
  • Neutral:  score < 0.5
  • Disease:  score >= 0.5
Score:  
0
  [min 0, max 1]
  • Neutral:  score < 0.5
  • Disease:  score >= 0.5
Score:  
0
  [min 0, max 1]
  • Polymorphism:  score < 0.5
  • Disease causing:  score >= 0.5
P-value:  
0
  [min 0, max 1]
  • Neutral:  p-value > 0.05
  • Pathogenic:  p-value <= 0.05
Score:  
0
  [min 0, max 1]
No hard-thresholds were indicated by authors (ref). Indicatively:
  • Neutral:  score < 0.9
  • Pathogenic:  score >= 0.9
No score. Categorical only
Please refer to Additional File 14: Table S10 for further details.
Score:  
0
  [min 0, max 1]
  • Neutral:  score < 0.98
  • Deleterious:  score >= 0.98
Score:  
0
  [min 0, max 1]
  • Neutral:  score < 0.5
  • Disease:  score >= 0.5
Score:  
0
  [min 0, max 1]
  • Neutral:  score < 0.5
  • Deleterious:  score >= 0.5
Score:  
0
  [min -6, max 6]
  • Neutral:  score < 0
  • Deleterious:  score > 0
  • Inaccurate prediction:  score = 0
Score:  
0
  [min 0, max 1]
  • Neutral:  score < 0.5
  • Deleterious:  score >= 0.5
DS score:  
0
  [min 0, max 1]
  • Neutral:  score < 0.43
  • Deleterious:  score >= 0.43
Pathogenicity score:  
0
  [min 0, max 1]
  • Neutral:  score ≤ 0.5
  • Pathogenic:  score > 0.5


Pathogenicity score for this variant:  
0
  [min 0, max 1]
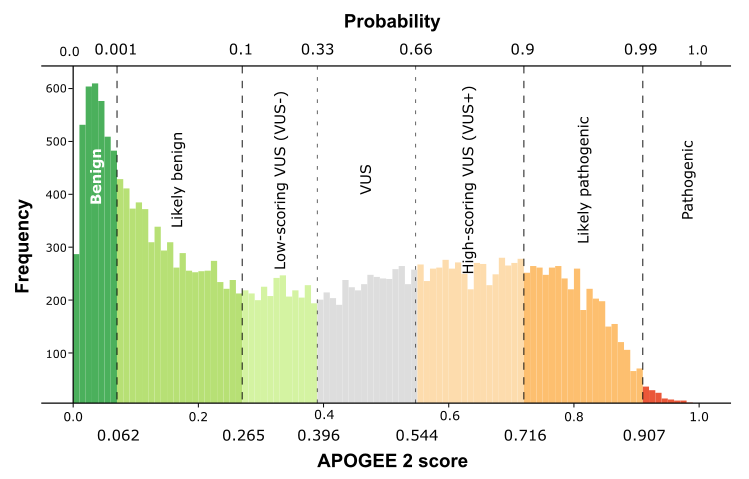
ACMG-AMP curations for mitochondrial variants should use the raw scores. Standalone probabilities are shown below:
  • Benign:  score ≤ 0.062 (prob. ≤ 0.001)
  • Likely-benign:  0.062 < score ≤ 0.265 (0.001 < prob. ≤ 0.1)
  • Low-scoring VUS (VUS-):  0.265 < score ≤ 0.396 (0.1 < prob. ≤ 0.33)
  • VUS:  0.396 < score ≤ 0.544 (0.33 < prob. ≤ 0.66)
  • High-scoring VUS (VUS+):  0.544 < score < 0.716 (0.66 < prob. < 0.9)
  • Likely-pathogenic:  0.716 ≤ score < 0.907 (0.9 ≤ prob. < 0.99)
  • Pathogenic:  score ≥ 0.907 (prob. ≥ 0.99)
Score:  
0
  [min -5, max 5]
  • Low impact:  score <= -1 (soft threshold)
  • Medium impact:  -1 < score < 1.5 (soft threshold)
  • High impact:  score >= 1.5 (soft threshold)
Score:  
0
  [min -5, max 5]
  • Low impact:  score <= -1
  • Medium impact:  -1 < score < 2 (soft threshold)
  • High impact:  score >= 2 (soft threshold)
Score:  
0
  [min -5, max 5]
  • Low impact:  score <= -1
  • Medium impact:  -1 < score < 2 (soft threshold)
  • High impact:  score >= 2 (soft threshold)
P-value:  
0
  [min 0, max 1]
  • Neutral:  FDR > 0.2
  • Driver:  FDR <= 0.2
The frequency of a CPD variant is proportional to the
number of aligned orthologous sequences that
carry a specific human pathogenic variant as
wild-type amino acid on the total number of aligned
sequences.

For more info, please check the output legend